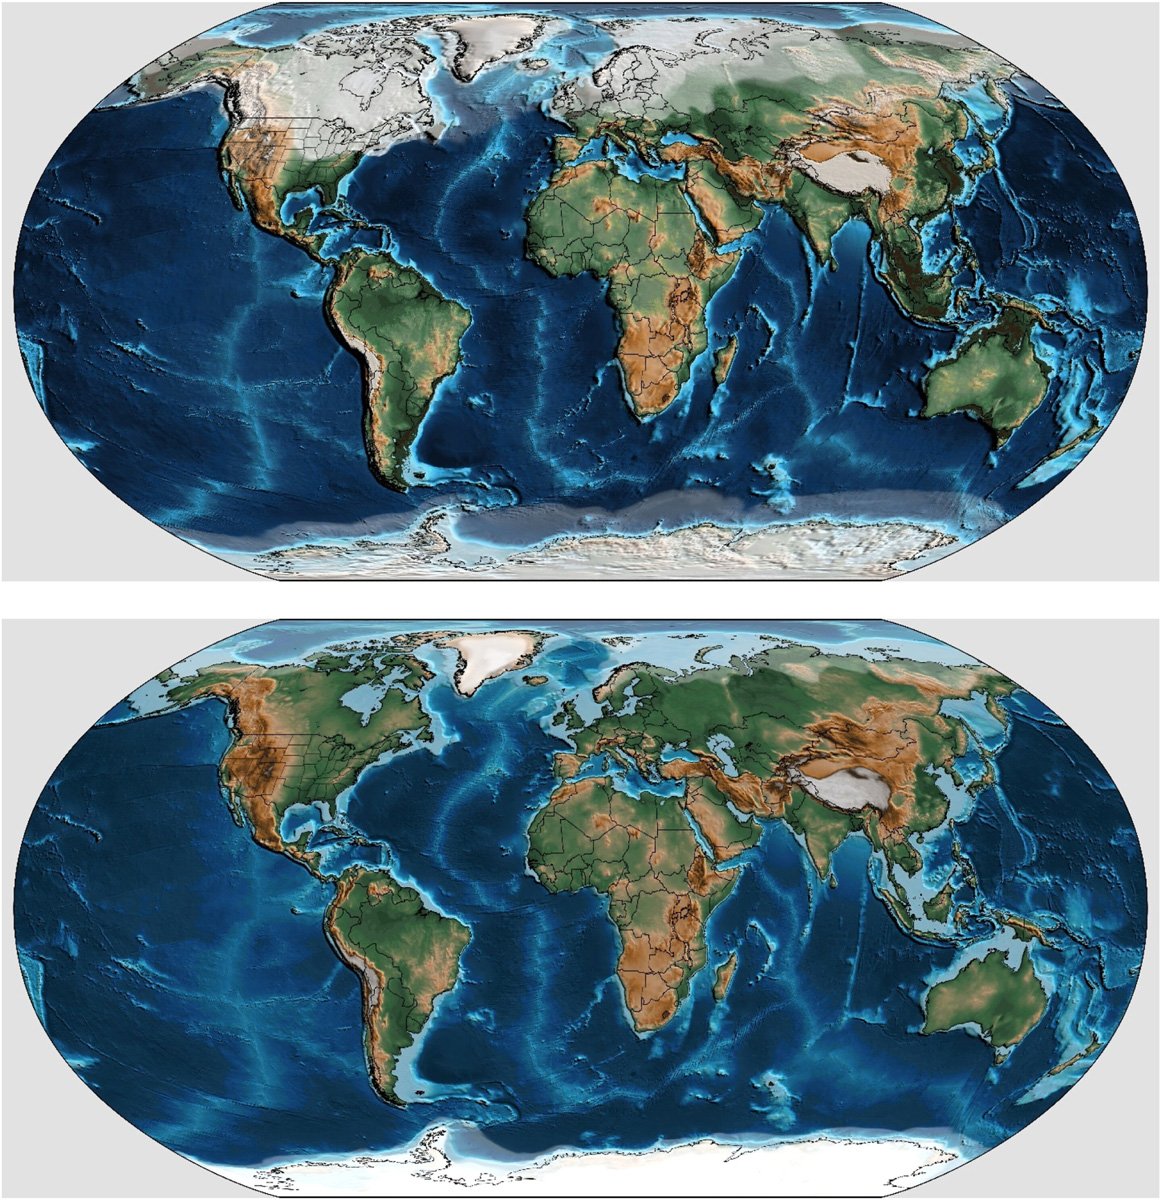
Changes in the Earth’s polar ice caps is responsible for the fluctuations in sea level. Traditionally, changes in sea level have been estimated by studying layers of sediment and associated fossils found in ancient basins. For example, the presence of claystone indicates that an area was deep under water.
Mapping short-term fluctuations in sea level over hundreds of millions of years
The authors of a recent study that mapped detailed sea level changes over the past 540 million years argue that these paleogeographic methods make it difficult to separate local geological and climate influences from global sea level trends. Other data sources, such as records of continental flooding, can track sea level changes over millions of years but are not detailed enough to pinpoint the more rapid fluctuations that occur every 20,000 to 400,000 years.
Known as Milankovitch cycles, these short term fluctuations are driven by changes in the Earth’s orbit and tilt. These cycles are important during ice age periods (icehouse climates), when ice sheets are large and sensitive to small climate shifts.
To map sea level fluctuations over shorter time periods, the authors of a study published in Earth and Planetary Science Letters used a well-established climate model of the Cenozoic (the past 66 million years). Previous studies have shown that short-term ice sheet changes caused by Earth’s orbital cycles tend to be larger when long-term ice volumes are greater. For example, during the Pleistocene, when massive ice sheets covered parts of the continents, both ice volume and temperature changes were large. In contrast, during the Eocene, when there was little to no permanent ice, these short-term variations were minimal or absent.
This model simulates ice sheet behavior and temperature changes at a high resolution of 1,000-year intervals. The study used estimates of past global temperature swings to calculate how far ice sheets extended and how much ice they held during different periods. By applying a relationship between ice area and volume from the Cenozoic to other ice ages, the authors estimated short-term sea level changes over the past 540 million years.
Results of the sea level study
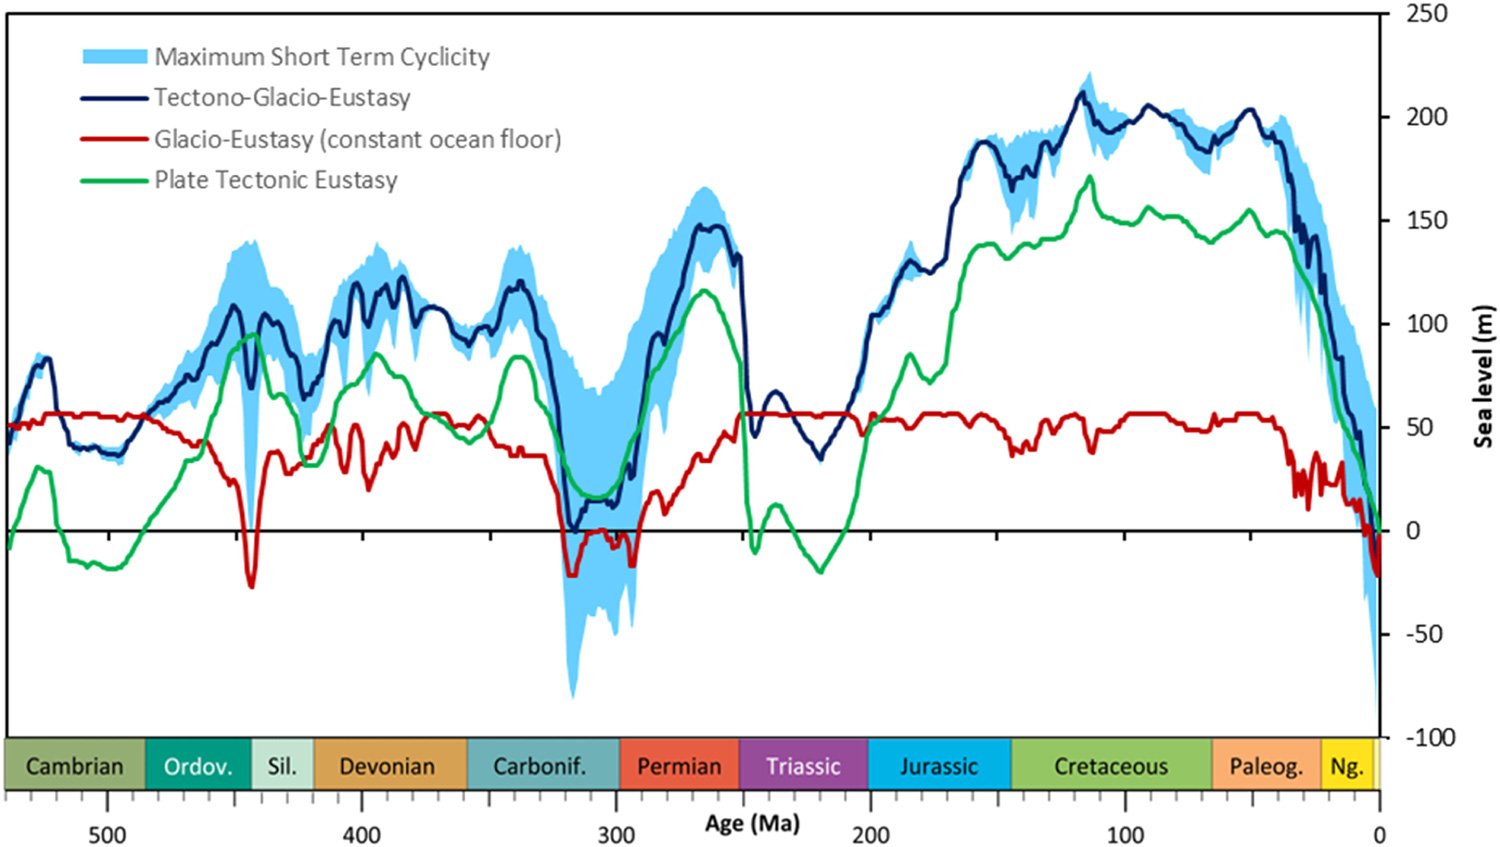
By combining their new short-term estimates with existing long-term sea level data, the authors created a more detailed temporal analysis of sea level changes over the past 540 million years. Their results show that during major ice ages, specifically the late Ordovician, Permo-Carboniferous, and late Cenozoic icehouses, sea levels could rise or fall by more than 100 meters over relatively short periods. These large changes are similar in scale to long-term sea level shifts driven by tectonic activity.
During the middle Ordovician to early Carboniferous (460–340 million years ago) and the Late Jurassic to early Cretaceous (160–110 million years ago), sea level changes were more moderate, typically in the range of a few tens of meters. During warmer intervals like the Cambrian to early Ordovician, Triassic to middle Jurassic, mid-Cretaceous, and early Eocene, there was little to no short-term glacial influence on sea level because long-term ice sheets were mostly absent.
The study
Van der Meer, D. G., Stap, L. B., Scotese, C. R., Mills, B. J., Sluijs, A., & van Hinsbergen, D. J. (2025). Phanerozoic orbital-scale glacio-eustatic variability. Earth and Planetary Science Letters, 667, 119526. DOI: 10.1016/j.epsl.2025.119526