Towns, cities, and rural areas do not exist in their own bubbles. Instead, residents regularly travel for daily, monthly and yearly activities. For example, someone living in a small city may commute to the neighboring intermediate city for work and occasionally access the airport or major concerts and festivals hosted in the proximate large city. These travels weave various locations together into functional city-regions.
Why functional delineation matters
The concept of how cities and regions interact is increasingly crucial for more effective regional planning, resource management, and sustainable development. The idea traces back to Walter Christaller’s Central Place Theory in 1933.1Historically, standard mapping and spatial analysis has relied heavily on administrative or political boundaries, or simplified rural vs urban classifications. While recent work such as the Degree of Urbanization (DEGURBA) and the Urban-Rural Catchment Areas (URCA) introduced vital nuance,2,3 the global interconnections among urban centers and their surrounding areas remained largely unanalyzed.
However, a recent paper by Cattaneo et al (2024) addresses this, providing a systematic worldwide delineation of multi-tier city-regions.4 This research, together with the global dataset,5 offers a new way to understand urban interconnectedness, showing how populations globally access multiple tiers of urban centers (towns and small, intermediate, and large cities) within realistic travel times.
Strikingly, 41% of the global population (3.2 billion people) could reach multiple tiers of urban centers within an hour in 2020. This vast number, representing nearly half of humanity, demonstrates an unexpected level of interconnectedness, providing diverse urban services within practical daily travel times. Another important finding highlights the outsized role of intermediate cities (between 250,000 and 1 million people) in regional connectivity: people living in or near towns and small cities were twice as likely to easily reach intermediate cities compared to large cities.
Exploring city-regions around the world
Building on Cattaneo et al’s insights, the new FAO City-Region Explorer data analytics platform provides an intuitive user experience for a broader audience, not limited to those with GIS backgrounds. The interactive map combined with advanced data analytics makes it easier to discover the roles of more than 30,000 urban centers within their regions.
The user can filter by country of interest and travel time threshold (1, 2 and 3 hours), as well as the activity tiers that describe a spectrum of possible services provided by the city-regions:
- T1 covers everyday essentials like grocery shopping and primary schools
- T2 includes services like general hospitals
- T3 moves into specialized areas like universities or sports complexes
- T4 represents major hubs like sizable airports or specialized hospitals
Activity Tiers are directly linked to urban tiers, categories of urban centers based on population size, whereby it is assumed that larger centers offer a wider range of activities:
- Towns (20,000 – 50,000 people) primarily offering T1 activities
- Small cities (50,000 – 250,000 people) providing T1 and T2 activities
- Intermediate cities (250,000 – 1,000,000 people) offering T1, T2, and T3 activities
- Large cities (over 1,000,000 people) that are comprehensive hubs, providing all activity tiers (T1-T4)
Moving beyond administrative boundaries
The U.S. takes a relatively unique approach to understanding the connection between cities and their surroundings. For decades, the Office of Management and Budget has defined Metropolitan and Micropolitan Statistical Areas – together called Core Based Statistical Units (CBSAs) – to map economic and social integration between urban cores and nearby counties. This method aligns economic data with administrative boundaries, especially for tracking commuting patterns. Metropolitan Statistical Areas (MSAs), which include at least one urban area of 50,000+ people,6 reflect the concept of a 1-hour city-region, capturing the immediate influence of major urban centers.
However, the new city-region delineation, with its gridded, travel-time based approach, offers key advantages over CBSAs. While CBSAs provide insights into established economic areas, they are limited by county boundaries and focus on shorter-distance integration. In contrast, the city-region method reveals how populations access urban services up to three hours away, regardless of county lines. This makes it especially useful for cross-country analysis, as it is not tied to national administrative units.
City-regions are built from patches—geographic areas defined by a unique mix of urban catchments across activity tiers for a given travel time. Each patch is assigned a type based on its urban tier combination, as shown in the figure below.

Source: Cattaneo, A. et al. Worldwide delineation of multi-tier city–regions. Nature Cities 1, 469–479 (2024).
Possible combinations of multi-tier catchments and resulting city-region patches. Each box’s four-digit number indicates the patch type and urban tier for four activity levels at the starred location.
Source: Cattaneo, A. et al. Worldwide delineation of multi-tier city–regions. Nature Cities 1, 469–479 (2024).
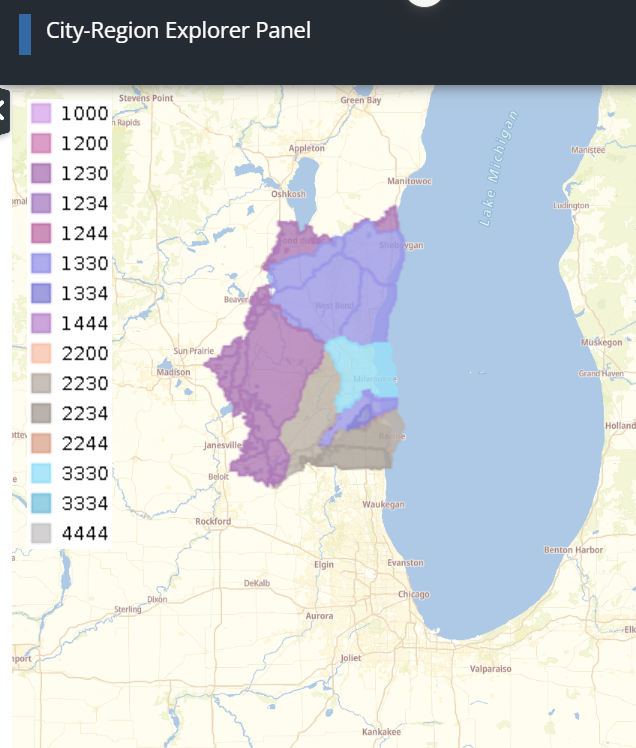
A city-region is a collection of patches sharing the same urban center across one or more tiers at a specific travel time. The interactive platform’s City-Region Explorer Panel offers detailed insights into these patches.
Because city-regions can overlap, it is important to distinguish between primary city-regions and secondary city-regions. In primary city-regions, all patches share the same highest-tier urban center. Large cities always form primary city-regions, as no higher tier exists above them.
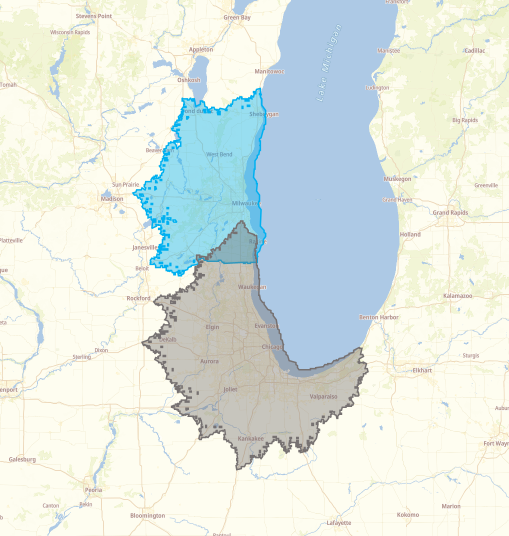
Secondary city-regions include patches that can access a higher-tiered center in another city-region. For instance, parts of the Milwaukee city-region fall within Chicago’s, meaning residents may rely on Milwaukee for everyday needs but turn to Chicago for specialized services—like more flight options from O’Hare.
Source: FAO (2025) City–Region Explorer.
The patch-level detail enables precise analysis of overlapping city-regions. For example, the map below shows how parts of the Milwaukee city-region—specifically patch types 1334, 2234, and 1234—are functionally connected to Chicago. The accompanying data table highlights urban centers like Racine and Kenosha, which fall within Milwaukee’s region for tier 3 services but access Chicago’s higher-tier services.
Source: FAO (2025) City–Region Explorer.

Source: FAO (2025) City–Region Explorer.
Urban connectivity in the United States
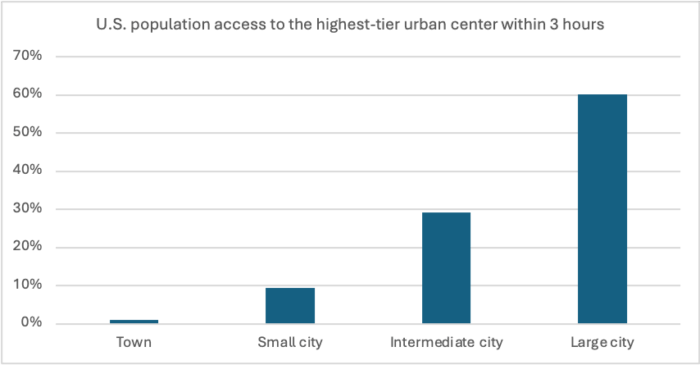
In the United States, large cities play a key role in regional connectivity, providing access to 60% of the population within three hours. However, intermediate cities are also significant, as they serve as the highest-tier urban center within three hours for nearly 29% of the population (nearly 97 million people). Additionally, 9% of people can only reach small cities within that timeframe.
While large cities are vital for regional connectivity, intermediate and small cities also play a crucial role and should not be overlooked. Their accessibility and services shape the daily lives of millions, contributing to a more balanced and resilient national network.
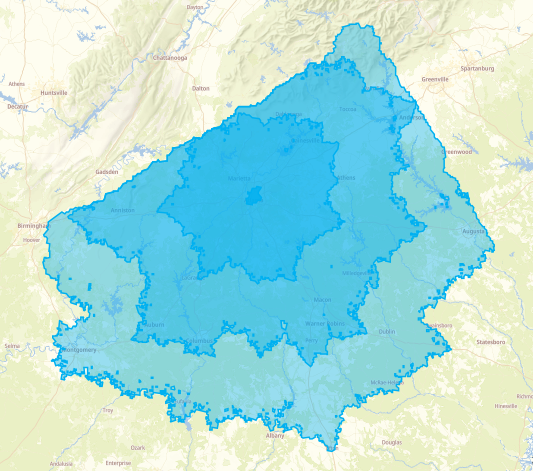
Zooming in on Atlanta, it is clear how intermediate cities can serve as regional powerhouses. Beyond its urban core of over 430,000 residents, Atlanta’s influence extends widely – reaching over 6.6 million people within one hour, 8.5 million in two, and more than 10 million within three hours. These impressive numbers are dynamically calculated in the City-Region Explorer Panel.
Source: FAO (2025) City–Region Explorer.
Whether it is for a single location, one country, or an international comparison, the City-Region Explorer is a valuable and free resource for a wide range of research. You can access the Full dataset on Zenodo, or watch the launch webinar and tutorial videos to learn how to get started.
References
1. Christaller, W. Die zentralen Orte in Süddeutschland (the central places in southern Germany). Jena Gustav Fisch. (1933).
2. Dijkstra, L. et al. Applying the Degree of Urbanisation to the globe: A new harmonised definition reveals a different picture of global urbanisation. J. Urban Econ. 125, 103312 (2021). DOI: /10.1016/j.jue.2020.103312
3. Cattaneo, A., Nelson, A. & McMenomy, T. Global mapping of urban–rural catchment areas reveals unequal access to services. Proc. Natl. Acad. Sci. 118, (2021). DOI: /10.1073/pnas.2011990118
4. Cattaneo, A. et al. Worldwide delineation of multi-tier city–regions. Nat. Cities 1, 469–479 (2024). DOI: /10.1038/s44284-024-00083-z
5. Girgin, S. et al. Worldwide Delineation of Multi-Tier City-Regions. Zenodo (2024). DOI: /10.5281/ZENODO.10473109
6. Bureau, U. S. Metropolitan and Micropolitan: About. Census.gov (2025).
About the author
Theresa McMenomy hails from the Twin Cities and now lives in Rome, where she works as an economist for the Food and Agriculture Organization of the United Nations (FAO). She contributes to the research and writing of The State of Food and Agriculture, FAO’s annual flagship report, and occasionally applies GIS tools to explore key issues related to agrifood systems. She holds a bachelor’s degree in Latin American Studies and Spanish and Portuguese from the University of Minnesota, Morris, and a master’s in Agriculture, Food and the Environment from the Friedman School of Nutrition Science and Policy at Tufts University.